Click Here to register our Free Weekend Newsletter - left column on home page

|
||
1) MARKET SUMMARY: Excerpted from Thursday's paid content of "The Daily" by Jon Johnson at InvestmentHouse.com. To get his latest information and his daily content, click here now to receive a two-week trial and save $30/month. (You won't find this offer on the Investment House website. It is exclusively for The Weekender subscribers!) The Trade Dispute With China Continues.
|
||
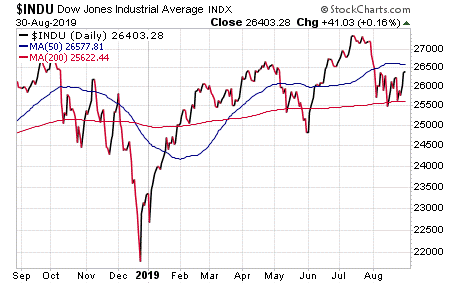
Market Summary (continued from above) On Wednesday, we mused about the up one day, down the next pattern in the market and questioned whether it could continue on Thursday with a downside session. There were some very good upside patterns after that Wednesday gain with some areas (such as machinery/manufacturing and some financials) that had been really beaten down starting to show some double bottoms. We also talked about the headline-driven action in the market. We are always just one headline away -- up or down -- from the market breaking in the direction favorable to the headline. On Thursday, it appeared that it was China’s turn to blink as the Chinese commerce ministry spokesman, at his regular press meeting, stated, with a "calm attitude," that China was willing to work on trade with the United States and that the two sides are in “effective contact” right now. He noted that while China “has options” if it chooses to retaliate, he feels it is best to discuss the U.S. choosing to remove the new tariffs as the first course of business. Thus, after President Trump’s blink in delaying some of the tariffs, China blinked unannounced. This makes one wonder if the two leaders are dancing through a kind of choreographed two-step. Nah. S&P 500: It gapped and rallied to close over the 50-day moving average (MA). Now, the S&P 500 is approaching the top of the past three weeks. This is the third bounce higher off the initial low versus two sell-offs. Once again, we will have to see if the upside has the strength to make the move. NASDAQ: It gapped higher, rallied through the 50-day exponential moving average (EMA) but then faded to close at that level. Even so, it is still considerably below the top of the range and still has room to test higher. Meanwhile, its volume is up and is roughly matching the downside volume from Tuesday. DJ30: It gapped and then rallied to close over the 50-day EMA. While it currently lies below the top of the range, about 70 points, this is nothing in light of the Thursday surge. NOTE: The figures and information above are from the 8/29 report. Watch Market Overview Video Watch Technical Summary Video Watch Next Session Video NOTE: The videos are from the 8/29 report. Here are two trades from "The Daily," offering insights into our trading strategy and the targets that we have hit this week:
Company Profile Triangle. We have talked about NVDA’s nine-month triangle that has formed a double bottom with a handle over the the last five to six weeks. Over the past week, the handle formed over the merging 50-day and 200-day MA. It then saw a tight doji on Wednesday at the 200-day simple moving average (SMA) on light trading and then faded from the upper trendline over the past week on mostly lower trading. Always watch for these higher lows at key levels inside these patterns as they often presage a breakout move. Accordingly, watching for a strong break higher. This is a great pattern, and if NVDA makes a break upside, it would be a good risk/reward for a move from the May gap. That move would give us a gain of around 10% on the stock and a gain of around 90% on the options. WMT (NYSE: Walmart) Company Profile
Double bottom w/handle. After a breakout in early June and rally to mid-July, WMT has formed the current double bottom. It then gapped upside through the 50-day MA on earnings, spent the last week testing and then moved back to the 50-day EMA. It tested that level on last Friday's low and bounced on the following Monday. If WMT continues, we want to play a move back to the prior high as the initial target. That move would give us a gain of around 55% on the options. Targets Hit This Week: Chipotle Mexican Grill (NYSE:CMG): In late July, CMG gapped higher from a seven week flat trading range and rallied to the end of the month. This was a good move, even though we did not chase this gap as we knew that we would get another chance at entering. To start August, CMG tested that move and came back to the 20-day EMA -- after a late July test of the 50-day MA before that gap higher. This makes a good test and new run. Anyways, the fact that it tested the 20-day EMA had us ready to play the upside as CMG started a new leg. On 8/7, it made the bounce off the 20-day EMA and we bought September $795.00 calls for $34.80. CMG gapped higher during the next session and then rallied more on top of that on 8/9. During that session, the large cap indices hit the top of the range and started to fade. We then decided to sell part of the position since the options were priced at $47.00 and banked a gain of 35%. We held the rest to see if CMG could maintain its trend. Indeed, CMG came back to test the 20-day EMA moving average for a session, started back upside and became a really strong stock as it ignored the market and showed the usual rise and fade, rise and fade over the 10 and 20-day EMA in a good uptrend. On Tuesday, CMG gapped higher and hit our initial target. We sold some more options for $58.80 and banked a gain of 63%. Coupa Software Inc. (NASDAQ:COUP): COUP is one of the cloud software stocks we started playing back when its price was in the thirties and its daily average volume had it under most people’s radar. The patterns kept setting up over and over, and it would break higher again and again. Eventually, the average volume of this stock grew as its name caught on. We just kept playing it. This last play involved a 50-day EMA test. That is, COUP had rallied from April off a significant test of the 50-day MA, moved up the 20-day EMA with four touches. After that, we started looking for a new 50-day MA test. Sure enough, the begining of August saw COUP give us what we wanted and we put it on the report for the next rally. On 8/8, COUP broke higher off the 50-day MA after a bounce and a quick intraday test two sessions later. Since this was a good signal, we moved in with some September $135.00 strike call options for $11.10. Well, COUP wanted another test and faded into 8/14 with another 50-day MA test. It even undercut that support during that day, and importantly, held it when the market closed. Thus, we had to see if that support would hold before we would act. It did, so we held the position. COUP rallied into Tuesday (8/27), touching our initial target at the prior highs. As the options were selling for $16.80, we were able to sell for $16.90 and bank a gain of 52%. Receive a two week trial and if you stay on receive a $30 per month discount! |
||
2) IH ALERTS NASDAQ:CHUY (Chuy's Holdings--$24.35; +0.21; optionable): Restaurants Company Profile EARNINGS: 11/07/2019 STATUS: Pennant. A nice gap breakout during the first week of August cleared several recovering highs and the early November downside gap. It is always an important move when a stock clears the interim recovery highs in a base. Indeed, this one started off the July 2018 high. Looking back, it was a classic four downside gap move that reversed after the last gap. Now, after seven months of forming the base after that low, CHUY made a strong move higher and was ready to form the right side of the base. It then came back to fill the early August gap higher and sat at the 20-day EMA and on top of the interim highs. We then waited for a new break higher to move in with an initial target at the early August high. That should be the start as there were other gaps to fill up. First things first: break higher and then move in. A rally to the initial target would give us 10% on the stock and around 80% on the options. VOLUME: 42.129K Avg Volume: 139.147K BUY POINT: $24.94 Volume=200K Target=$27.45 Stop=$24.11 POSITION: CHUY OCT 18 2019 25.00C -- (45 delta) &/or Stock CHART IMAGE Save $600 per year and enjoy a two week trial of our IH Alerts Service! |
||
3) SUCCESS TRADING GROUP -- by the MarketFN STG Team NYSE:PINS (Pinterest Inc.) Company Profile Our Success Trading Group members scored another winning trade when we closed out a position in Pinterest Inc. (NYSE:PINS). We are watching several other stocks and are looking forward to trading next week. Our Success Trading Group closed seven years with zero losses on our Main Trade Table. In fact, we closed 100% winning trades for the calendar years 2016, 2015, 2013, 2012, 2011, 2010 and 2009. We still have one open position from 2017 (all others were winners) and one trade that we opened in 2014 but was closed as a losing trade. All of these trades are posted on our Main Trade Table for your review during your free membership trial period. Get Our Next Trade Free - Save $50 per month! Details Here. |
||
4) COVERED CALL PLAY NASDAQ:RDHL -- Redhill Biopharma Ltd. is currently trading at $7.52. The October 19 $7.50 Calls (RDHL20191019C00007500) are trading at $0.45. That provides a return of about 11% if RDHL is above $7.50 by the time of the expiration. Company Profile Learn more about our Covered Call Tables |
||
|
||
The foregoing is commentary for informational purposes only. All statements and expressions are the opinions of Online Investment Services, LP., or Split Ventures, Ltd. This information is not meant to be a solicitation or recommendation to buy, sell, or hold securities. We are not licensed or registered in the securities industry. The information presented herein and on the related web site has been obtained from sources believed to be reliable, but its accuracy is not guaranteed. The security portfolios of writers for this issue may, in some instances, include securities mentioned herein and on the related web site. Estimates, assumptions and other forward-looking information are subject to the limits of forecasting. Actual future developments may differ materially due to many factors. No one associated herewith receives compensation in any manner from any of the companies that are discussed in this newsletter or on the related websites. This is a commerical email. It may contain advertisment or solicitation. This email was sent to ~~EMAIL~~. Please click the following link to change or unsubscribe. All Rights Reserved. 300 New Jersey Ave, Suite #500, Washington, DC 20001 |
||
|


No comments:
Post a Comment